
Highlights
- Canada has experienced around 300 catastrophic weather events since 1983, with both the frequency and cost of these disasters rising significantly in recent years.
- Over 60% of total insured losses caused by weather disasters between 2008 and 2024 stemmed from damage to personal property.
- Average insured personal property losses have nearly doubled in the past five years compared to previous years, putting significant pressure on Canada’s home insurance sector for both insurers and households faced with rising home insurance rates.
- The increase in home insurance costs was generally higher in areas that have experienced greater insured damages from weather disasters. As well, some highly-impacted areas also face rising deductibles or reduced coverage for certain perils like hail or floods.
- Fiscally-constrained governments are also rethinking the level of financial assistance provided through disaster recovery programs to support communities recovering from uninsurable losses as costs of weather disasters rise.
Canada has had over 300 catastrophic weather events since 1983. These are currently defined as weather disasters that cause at least $30 million in insured losses, though lower thresholds were used prior to 2022. The average number of annual catastrophic events has increased over time as have insured losses associated with these events. Insured losses vary by province with Alberta accounting for the largest share of total insured losses between 1983 and 2024, followed by Ontario and Quebec. The three provinces are the only ones that have been hit by billion-dollar-plus catastrophic events so far, with Alberta alone having had five as of 2024.
More than 60% of insured losses from 2008 to 2024 were due to damage to personal property. In addition, the costs have increased substantially in recent years with insured damages to personal property during 2020-2024 being almost twice their level in the previous decade. Moreover, the insurance industry in Canada incurred underwriting losses in the personal property line of business in 2023 and 2024 as insured damages and operational expenses exceeded revenue earned from premiums.
These changes have contributed to rising home insurance premiums, especially in areas hardest hit by severe weather, with Alberta being the most notable example of the variation in insurance cost increases between more and less vulnerable areas. Additionally, high-risk areas face other adjustments to home insurance policies including higher deductibles – for example, for hail coverage in areas that have experienced substantial damage from hailstorms. In worst case situations, insurance coverage is simply not available for certain perils such as overland flooding in areas of the country deemed most at risk of flooding. Meanwhile, as households that are most vulnerable to severe weather are feeling the squeeze from the private insurance market, government disaster recovery programs, which have historically acted as an insurer of last resort, are also beginning to restrict the level of support provided to impacted communities as these programs are also contending with rising costs of extreme weather.
Insured Damages from Catastrophic Events Have Increased Significantly

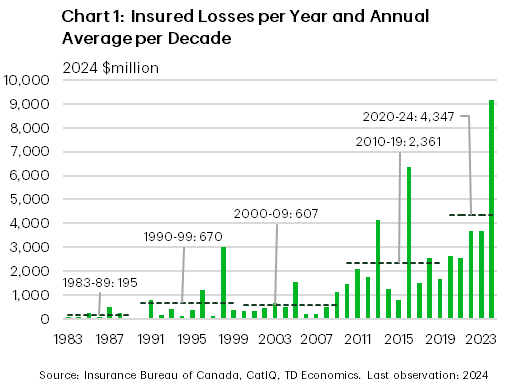
More than 300 catastrophic weather events have occurred since 1983, causing nearly $60 billion in insured damages as of 2024. Annual insured catastrophic losses have been rising over this period and exceeded $4 billion per year on average in the last five years, almost twice the level during 2010-2019 and significantly greater than losses incurred in the decades prior to 2010 (chart 1). These estimates include physical damage to vehicles, personal and commercial property as well as non-physical costs like disruptions to business operations or additional living expenses incurred by displaced individuals. However, most of the insured losses were due to the physical damage caused by severe weather. Moreover, in almost every single year since 2008, insured personal property losses accounted for over half of total insured catastrophic losses.
The decadal increase in insured catastrophic losses has been driven by a higher frequency of severe weather events and more costly individual weather disasters in recent years. In the 1980s, there were about two catastrophic events on average per year while the 2020-2024 period averaged 15 events annually. As would be expected, the more events there are, the greater the damage to properties and infrastructure is likely to be, all things being equal. In addition to this, the average insured cost per event has exceeded $200 million since 2010, roughly double its level during earlier decades (table 1). The top 10 list of the costliest severe weather events in Canada also illustrates the same point that extreme weather is causing increasingly greater damage to properties and infrastructure. Nine of the ten most damaging events happened during 2010-2024, with the 1998 Ice Storm being the only outlier on this list (chart 2).
Table 1: Average Number of Events and Insured Loss per Catastrophic Event by Decade
| Period | Average # of events per year | Average loss per event (2024 $k) |
| 1983-1989 | 2 | 105,000 |
| 1990-1999 | 5 | 126,400 |
| 2000-2009 | 5 | 116,700 |
| 2010-2019 | 11 | 218,600 |
| 2020-2024 | 15 | 286,000 |
Ontario More Prone to Catastrophic Events, But Alberta Has Suffered Greater Losses
Every region in Canada has sustained severe weather incidents that cause catastrophic insured damages, except for Yukon and Nunavut, which is likely to do with the small populations and economies of the territories. Ontario has been affected the most, having been hit by around 36% of the catastrophic events that happened between 1983 and 2024. Alberta (32%), Quebec (25%), Saskatchewan (18%) and Manitoba (11%) were hit by the next highest number of these events, with the remaining regions being affected by less than 10% of the events.1 While insured losses in individual provinces may not meet the catastrophic definition threshold for some weather disasters that affect multiple provinces, such events are still included in the count of each of the provinces they affected in these estimates.
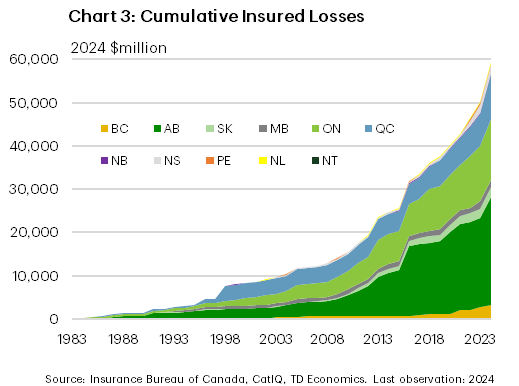
Although Ontario has been hit by the highest number of catastrophic events, Alberta accounts for the largest share (42%) of insured catastrophic losses incurred since 1983, equivalent to the combined share for Ontario (24%) and Quebec (17%), the second and third highest ranked regions for losses (chart 3). As of 2024, Alberta had been hit by five severe weather events that included two wildfires, two hailstorms and a flood, which caused over a billion dollars each in insured losses in the province. These events represent half of the province’s insured catastrophic losses between 1983 and 2024 and just over a fifth of the national amount and help explain the gap in insured losses between Alberta and other provinces. Ontario and Quebec are the only other provinces that have had severe weather events that resulted in billion dollar-plus insured losses.
Personal Property Losses are Straining the Home Insurance Market
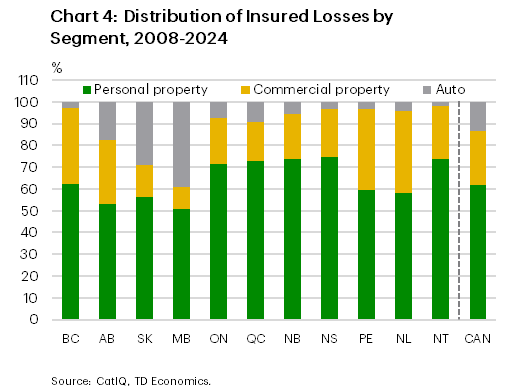
From 2008 to 2024, the personal property segment accounted for more than 60% of insured losses caused by severe weather, with commercial property making up about one-quarter of the losses and vehicles accounting for the remainder. Across different regions, personal property losses retain the largest share, though the proportions vary by province or territory, ranging from just over 50% in Manitoba to nearly three-quarters in Nova Scotia (chart 4).
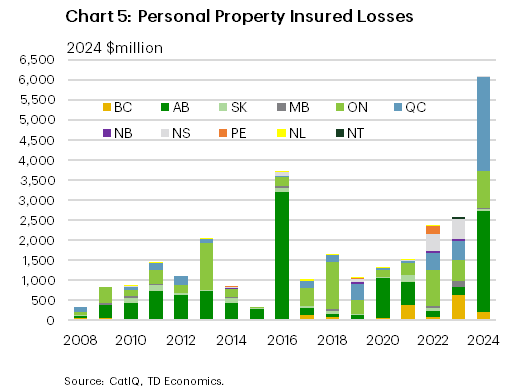
Trends in insured personal property damages are largely similar to those for total insured losses discussed above although the personal property losses data covers a shorter period. Annual insured personal property losses have been trending upwards. Both 2022 and 2023 had the highest insured personal property losses since 2016 while 2024 set a new record, with personal property losses at around $6 billion, 63% higher than the previous record from 2016 (chart 5). For the five-year period from 2020 to 2024, insured personal property losses averaged around $2.8 billion per year, nearly twice their level from the prior decade. At the regional level, Alberta (40%), Ontario (26%) and Quebec (17%) again account for most of the insured losses from personal property between 2008 and 2024 (chart 5).
Growing insured personal property losses are placing considerable strain on Canada’s home insurance sector. In both 2023 and 2024, insurers faced underwriting losses in the personal property business, paying out $1.01 for claims and expenses for every $1 collected in premiums. The situation was especially severe in Alberta, where claims and operating costs in 2024 exceeded premium revenues by nearly 20%.2 In response, insurance companies have started raising home insurance premiums and revising coverage options, particularly in areas at higher risk as we discuss below. Canadian insurers in turn are also facing increasing reinsurance costs for property coverage broadly across the industry, even for portfolios that have not incurred recent losses which saw property reinsurance premiums increase by 25-30% during the 2023 renewal cycle. Reinsurance cost increases were much higher (up to 50-70%) for portfolios with recent losses.3
Insurance Costs Increased More in Areas Most Affected by Severe Weather
To assess how changes in home insurance premiums are correlated with insured losses from weather disasters, we use industry-wide data for personal property insured losses by forward sortation area (FSA)4, combined with internal data on home insurance pricing. FSA-level loss information is available for seventeen weather disasters that occurred over the past decade. Collectively, these events represent about 62% of national insured personal property losses over the same period (table 2).
The analysis provides a detailed view of how regions most affected by severe weather events have experienced varied trends in insurance costs, highlighting the relationship between local loss experience and premium adjustments over time. While it is easier to find information on insurance premium trends at the provincial level, there is limited insight into how insurance costs differ within individual provinces, particularly when considering the impact of weather disasters.
Using the FSA-level loss information, we divided the FSAs into two groups. The first group comprised FSAs that had incurred at least $10 million in total insured personal property losses from the seventeen events, while the second group included FSAs with losses below the $10 million threshold. Most of the provinces had at least one FSA that fell into the first group, with Saskatchewan, Manitoba and Newfoundland and Labrador being the exception.
Among the provinces in which available FSA-level losses represent more than half of personal property insured losses (PE, AB, QC, NS), home insurance premiums rose faster in FSAs in the first group compared to FSAs in the second group that had smaller losses. The difference in insurance rates growth between the two groups of FSAs is most evident in Alberta, which has endured higher insured losses and has more complete data compared to other provinces (table 2).
Focusing on Alberta, the average premium for FSAs in the first group increased by 57% between 2021 and 2025 versus a rate growth of 43% for FSAs in the second group, which had average insured personal property losses of less than $10 million. As a result, the average premium for the former group is almost 10% higher than that of the latter group, up from being 0.5% lower just five years earlier. In addition, among FSAs in the second group, the rate increase was higher for FSAs that are adjacent to those in the first group (51%) than for those that are non-adjacent to group 1 FSAs (39%). This is partly because average insured losses are higher for the group 2 FSAs that are adjacent to the first group.
Similarly in Prince Edward Island, Quebec and Nova Scotia, FSAs that had insured personal property losses of $10 million or more (group 1) saw a faster increase in home insurance costs relative to FSAs that faced lower losses. The gap in the average premium growth was around 11 percentage points in Prince Edward Island, and lower in Nova Scotia and Quebec at 3.7 and 2.3 percentage points, respectively. For Quebec in particular, it is likely that the effect of the losses has not yet been reflected in pricing data as most (around 90%) of the losses for Quebec FSAs in group 1 were due to the impact of the August 2024 flood caused by the remnants of Hurricane Debby.
Table 2: Change in Nominal Home Insurance Premiums by Exposure to Insured Personal Property Losses
| Region | FSA-level insured personal property losses as % of total insured personal property losses (2016-24) | # of FSAs with insured personal property losses of $10M+ (Group 1) | # of FSAs with insured personal property losses below $10M (Group 2) | 2021-25 change in home insurance premiums for FSAs in Group 1, % | 2021-25 Change in Home Insurance Premiums for FSAs in Group 2, % | ||
| All Group 2 FSAs | Group 2 FSAs adjacent to Group 1 FSAs | Group 2 FSAs not adjacent to Group 1 FSAs | |||||
| PE | 88.7 | 5 | 2 | 54.6 | 43.4 | NA | NA |
| AB | 80.2 | 24 | 131 | 57.5 | 43.4 | 51.1 | 39.0 |
| QC | 66.9 | 74 | 338 | 46.8 | 44.5 | 45.0 | 44.4 |
| NS | 54.9 | 10 | 67 | 48.5 | 44.8 | 46.1 | 44.0 |
| ON | 48.5 | 63 | 457 | 23.8 | 24.9 | 23.9 | 26.1 |
| BC | 41.9 | 4 | 183 | 67.6 | 63.3 | 68.8 | 62.8 |
| NB | 25.6 | 1 | 109 | 39.0 | 33.2 | 33.1 | 33.7 |
| NL | 3.9 | NA | 36 | NA | NA | NA | NA |
| SK | 1.1 | NA | 50 | NA | NA | NA | NA |
| MB | 0.0 | NA | 72 | NA | NA | NA | NA |
| CAN | 61.9 | 181 | 1454 | 38.2 | 35.0 | 32.6 | 36.5 |
High Risk Areas Also Face Adjustments to Insurance Coverage
In addition to raising home insurance premiums in response to growing losses, insurers are also adjusting the coverage offered in high-risk areas. The changes include increasing deductibles in home insurance policies and introducing peril-specific deductibles such as hail deductibles in Alberta’s “hailstorm alley”.5 In parts of Calgary that are most exposed to hailstorms, hail deductibles could be as high as $10,000 although it seems that insurers are also incentivizing homeowners to make their homes more resilient to hail damage by offering lower deductibles for properties that meet specified standards.6 Moreover, some insurers in Alberta are beginning to make hail coverage, which used to be included in the base home insurance policy, an optional add-on for consumers with additional premium costs while a handful of insurers no longer provide hail coverage in certain areas.7 Overland flooding is also uninsurable in high-risk areas, with about 1.5 million households in Canada estimated to live in areas that do not have access to flood insurance.8 In some high-risk areas where flood insurance is available, including the optional flood insurance coverage could add as much as $10,000-15,000 to the premium,9 which effectively puts the coverage out of reach for many households.
Government Support for Uninsurable Losses is Also Shrinking
Historically, government disaster recovery assistance programs have provided financial support to communities to help them recover from uninsurable weather disasters. However, these costs are also becoming unsustainable, prompting some governments to make changes to the programs. For example, the government of New Brunswick announced in 2023 that it would limit the lifetime assistance to fix structural damage caused by the same type of disaster to $200,000 per property, after which the property would be ineligible for assistance for damage caused by the same type of disaster.10 This followed a similar measure implemented in Quebec in 2019, which capped lifetime support to repair any property damaged by flood to $100,000.11 Additionally, as of 2021 the Alberta program provides support only once to any property even if it changes ownership though the amount that could be given for that one-time use is higher at up to $500,000.12
Bottom Line
Extreme weather is expected to continue growing over time as greenhouse gas emissions rise globally, underscoring the need for policies that help communities adapt to the changing climate. Weather-proofing buildings – through structural upgrades that improve resilience to severe storms, flooding, and hail, etc. — is crucial for safeguarding homes and communities. Insurer-led initiatives, such as lower deductible incentives for homeowners who invest in property upgrades to better withstand hail damage, represent proactive steps toward building climate resilience. To the extent it is not already happening, disaster recovery programs could also further encourage resilience by tying financial assistance for repairs to the requirement that homeowners incorporate upgrades designed to mitigate future weather-related risks. Moreover, as governments focus on accelerating housing construction to address the housing crisis, it is important to ensure that the new housing stock incorporates climate resilient materials and technologies and is built in areas that are less prone to severe weather hazards.
Another avenue for strengthening financial protection could be via the implementation of the proposed federal national flood insurance program, which is intended to make flood insurance more accessible and affordable for families living in high-risk areas.13 This initiative would help close the coverage gap for those currently unable to obtain flood insurance. In addition, the proposed measures include a plan to assist homeowners facing repeated flooding with relocating to safer, lower-risk areas—a policy tool already in use by some provincial governments (e.g., New Brunswick and Quebec) through buyout programs for severely damaged properties.
It is also essential for Canadians to have access to comprehensible and up-to-date information on local climate risks. For example, many of the country’s flood risk maps are said to be out of date,14 which may prevent people from making informed decisions about where to live and how best to protect their properties financially and physically.
Comments
Post a Comment